Guide By – Los Angeles Car Accident Lawyer
The mere number of motor vehicles on today’s roads leads to the high number of auto accidents. Despite modern vehicle safety features and stability control devices, the rate of car crash fatalities in the United States is increasing at an alarming rate. Based on the study by the National Safety Council, in 2016, motor vehicle crashes caused approximately 40,200 deaths. This was a 6% increase compared to 2015.
This firm’s extensive litigation, courtroom, and trial expertise make it a force to be reckoned with. Cherepinskiy Law Firm utilizes modern technology and unique legal strategies to successfully pursue every case from the initial investigation through trial.
Historical Perspective Regarding Car Accidents
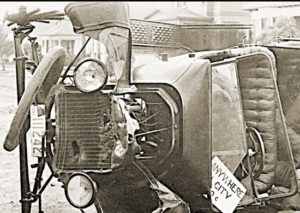 In the United States, during the last 100 years, the number of annual motor vehicle fatalities (including personal and commercial vehicles) saw a nearly 10-fold increase. For example, in 1913, motor vehicle crashes resulted in 4,200 fatalities. In 2017, the number of crash-caused deaths exceeded 40,200.
Despite the increase in the number of deaths caused by motor vehicle crashes, it is much safer to travel by car today than it was 100 years ago. Technological advancements in vehicle safety made a dramatic leap forward. Drivers have become more careful and responsible.
The reason more people die on the modern U.S. roadways than at the dawn of motoring is simple: there are significantly more vehicles and drivers on today’s roads. In 1913, in the U.S., there were approximately 1.3 million motor vehicles and the number of drivers was 2 million. Based on the statistical data, in 2017, there were roughly 273 million motor vehicles and 225 million drivers. This means that, today, there are 210 times more vehicles and over 136 times more drivers than one hundred years ago. For every 1000 motor vehicles on the road, the number of accident fatalities went from approximately 3.2 deaths (in 2013) to approximately 0.15 fatalities (in 2017). These numbers show that the actual motor vehicle death rate has decreased by over 95%.
Types of Car Accident Injuries
An auto accident may lead to serious and catastrophic injuries, as well as a fatality. The following is the listing of the most common injuries that can be caused by a car crash:
- Amputation and loss of limbs
- Back and neck injuries
- Bruising
- Blindness and eye injuries
- Burns
- Concussions
- Crush Injuries
- Cuts and scrapes
- Disfigurement and permanent scarring
- Fractures and broken bones (non-displaced, displaced, and compound fractures)
- Hearing Loss
- Hematomas (Internal bleeding)
- Internal injuries
- Joint Damage
- Post-Traumatic Stress Disorder (PTSD)
- Skin Injuries
- Soft tissue injuries
- Spinal cord injury and paralysis
- Traumatic brain injury (“TBI”)
- Whiplash
- Wrongful death
Causes of Car Accidents and Types of Auto Crashes
 The most common types / causes of car accidents are:
- Distracted Driving
- Impaired Driving
- Speeding
- Red-Light Running
- Wrong-Way Driving
- Sleeping at the Wheel / Falling Asleep While Driving
- Rollover Crashes
- Rear-End Collisions
- Side-Impact Crashes
Regardless of the type or a cause of the accident, the Los Angeles car accident attorney at Cherepinskiy Law Firm will apply unique skills and expertise to obtain maximum compensation on your behalf. Each of these common types / causes of car crashes is discussed in detail below.
1. Distracted Driving
Most people consider the process of driving to be a routine and mundane activity, which does not require any significant thought process. Unfortunately, the reality is that approximately 80 percent of car crashes are attributable to distracted driving. Fatal car accidents cause over 3,000 deaths on a daily basis, and many of these daily fatal crashes are caused by distracted driving.
- Due to various factors, U.S. drivers now drive much more than ever before, which accounts for the higher number of car accidents.
- Distracted driving has reached the status of an “epidemic”. It is one of the most preventable causes of car crashes.
- After an accident occurs, in most cases, it is virtually impossible to check whether or not it was caused by distracted driving. Therefore, analysts believe that the actual number of injuries and deaths caused by distracted driving significantly exceeds the reported data.
- Frequently, comparisons are drawn between distracted driving and drunk driving, because the drivers’ mentality is similar: the offending drivers keep engaging in this practice until either (a) they are stopped by a law enforcement officer and suffer the legal consequences of their behavior or (2) they get in a crash. Sadly, in many cases, this reckless behavior leads to tragic consequences.
Statistics with respect to Distracted Driving in the United States
Distracted driving is extremely dangerous. In fact, the statistical data from the National Highway Traffic Safety Administration (“NHTSA”) and other sources with respect to motor vehicle crashes as a result of distracted driving is shocking:
The number of deaths caused by distracted drivers:
-
-
-
- 2016: 3,450
- 2015: 3,477
- 2014: 3,179
- 2013: 3,154
- 2012: 3,328
-
-
The approximate number of injuries caused by distracted drivers:
-
-
-
- 2016: 330,000
- 2015: 391,000
- 2014: 431,000
- 2013: 424,000
- 2012: 421,000
-
-
General Statistical Data Regarding Distracted Driving
- 1 out of 4 fatal car accidents are caused by distracted driving.
- Every day, car accidents involving distracted drivers kill almost 7 people.
- When a driver diverts his or her attention from the road for a mere 3 seconds, it is a sufficient distraction to cause a crash.
- The vast majority of drivers (over 80%) admit that, either occasionally or routinely, they engage in the following kinds of dangerous behavior while driving: applying makeup, brushing hair, painting nails, shaving, eating, changing clothes, and steering with a foot.
Types of Crash-Causing Distractions
Deep Thought and Loss of Focus While Driving
The leading cause of distracted driving accidents (approximately 62%) is a driver engaging in a deep thought or letting his or her mind wander. This leads to the loss of focus and a crash. Drivers must keep their mind on the road; not just their eyes.
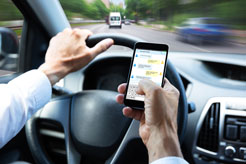
The Use of Cell Phones While Driving
Cell phone use is the second largest cause of distracted driving.
Modern cell phones and smart phones have taken the ease of communication to a whole new level. The immediate availability of web browsing, texting, e-mail, social media platforms, and a multitude of other applications going above and beyond simple telephone calls – have made people treat these devices as a part of their body.
Regardless of whether a driver is using hands-free and handheld telephone while driving, the amount of distraction on the cognitive level is the same.
Dr. David Greenfield, the founder of the Center for Internet and Technology Addiction, opines that cell phones, smart phones, and other electronic devices are very addictive and, therefore, it is difficult for a driver to set these items aside even when he or she is driving. On an instinctive and physiological level, human brain reacts to the sound alerts made when a smart phone receives a new text message, e-mail or a social media update. Specifically, these alerts cause a surge in the levels of dopamine, a neurotransmitter that helps control the brain’s reward and pleasure centers. As a result, the driver feels an irresistible need to check the device for any new updates, texts, or e-mails. This urge to look at the electronic device is so strong that it compels drivers to divert their eyes from the road and check the phone, even when they know that this behavior is dangerous to themselves and others.
Despina Stavrinos, the director of distracted driving research lab at University of Alabama at Birmingham at the time when this material was being compiled, explained the following psychological phenomenon: every time a driver uses his or her phone while driving and nothing “bad” happens (i.e. no accident, near-accident situation, or a law enforcement citation), the driver’s brain receives a reinforced signal that such a practice is “safe” and can be repeated over and over without any adverse consequences.
However, if a person decides to use these features while driving – i.e. check or send text messages and/or e-mail, or use social media and other applications – this activity is so risky and hazardous that it can easily cause a serious injury or even death.
The general cell phone statistical data, which shows the hazards of using mobile phones while driving, is staggering:
- Among all types of cell phone activities, texting is the most hazardous.
- During the day, at any given moment, over 600,000 drivers are making some attempts to use their cell phone features while in motion.
- During daylight hours, approximately 660,000 drivers use electronic devices while driving.
- Those drivers who talk on their phone while driving are 2.2 times more likely to get into a car crash.
- Dialing a phone leads to the 12.2 time increase in the likelihood of an accident.
- Based on the data from the National Safety Council, every year, the use of cell phones while driving causes approximately 1.6 million accidents.
- Each year, sending and checking text messages while driving causes almost 400,000 injuries.
- In the United States, 25% of all auto accidents are a consequence of texting while driving.
- As dangerous as drunk driving is, it is still 6 times less likely to lead to a crash than texting and driving.
- Texting and driving increases a driver’s time spent not focusing on the road by 4 times.
- If someone is texting while driving, it increases their likelihood of getting into a car crash by 23 times, even if it is another driver who causes an accident.
- When a driver checks or sends a text message, it leads him or her to take eyes off the road for approximately 5 seconds. At the speed of 55 miles per hour, this 5-second distraction is equivalent to driving across a football field blindfolded.
- Compared to adults, teen drivers who use their cell phones while driving are 4 times more likely to get involved in an auto accident or a dangerous near-accident situation.
- Most drivers indicate that they would support a complete prohibition of texting, e-mailing, and even talking on the phone while driving.
- Nevertheless, based on a poll data, shockingly, approximately 77 percent of adult drivers and 55 percent of teen drivers share a belief that they can manage the task of texting while driving with ease.
Statistics Regarding Other Types of Distracted Driving
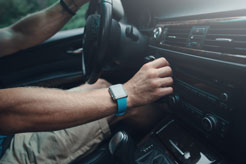
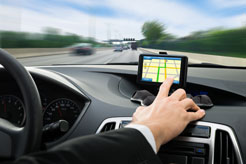
Modern vehicles offer the convenience of multiple advanced technology innovations.
These innovations include Bluetooth streaming, navigation systems, “infotainment” dashboards, and even video controls for the passengers. The majority of drivers (53%) share a belief that if automobile manufacturers offer these advanced technological conveniences, they must be safe to use while driving. However, drivers’ use of this built-in “high-tech” gadgetry contributes to the high rate of distracted driving.
In general, when drivers eat, read, or apply makeup while driving – they increase their chances of getting into a car crash by two to three times.
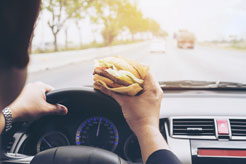
A study by the National Highway Traffic Safety Administration (“NHTSA”) determined that those drivers who eat or drink behind the wheel are 80% more likely to be involved in a car crash. Approximately 2% of accidents related to distracted driving – are caused by eating a simple snack behind the wheel. Consuming the following items while driving is especially dangerous:
-
- soda and carbonated drinks – may end up fizzing into a driver’s nose causing a distraction;
- hot coffee and soups – easily spill and can burn a driver, leading to a crash;
- tacos, burgers, and salads – cause food particles to drop into a driver’s lap, causing an impulse to clean;
- ice cream and chocolate – melt and drip on a driver’s clothing, which can be irritating and cause a distraction.
- Approximately 2%of distracted driving-related fatal traffic accidents are caused by adjusting climate controls (air conditioning or heater) and audio systems.
- Among fatal car accidents caused by distracted driving, 5% are related to drivers’ conversations with passengers. In fact, when a driver is listening to music or is engaged in a conversation while driving, almost half of the brain power is diverted away from the task of driving.
- During any trip with children, the driving parent or guardian spends approximately 21% of the total driving time diverting his or her attention away from the road and attending to children.
- When a teenage driver has a passenger, this doubles their risk of being involved in a fatal auto accident. However, if there are two or more passengers, the likelihood of a fatal crash is increased by 5 times.
- One fifth (20%) of drivers admitted to styling or brushing their hair while driving.
- Lighting or putting out a cigarette accounts for 1% of all auto accidents caused by distracted driving.
- Over 60 percent of drivers who had to drive with their dogs in the car indicated that they had been distracted by their pets.
- Approximately 7% of all distraction-related fatal auto crashes are caused by drivers diverting their attention away from the road to look at objects, people, animals, and various events occurring outside their car.
- Finally, it has been demonstrated that, if a driver has to use a bathroom and is holding it behind the wheel, this can be very distracting and dangerous.
2. Impaired Driving
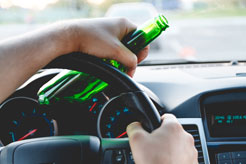
Drunk driving is lethal. However, despite the commonly known danger of drinking and driving, it is still a major problem in the United States.
Driving under the influence of alcohol or other substances (i.e. drugs) leads to accidents which cause severe injuries and death. Cherepinskiy Law Firm, as Los Angeles car crash attorney, encourages every driver to never drink and drive!
Alcohol is a chemical substance, which impairs a person’s central nervous system by reducing both (1) cognitive abilities (brain function, focus, thinking, judgment, and reasoning) and (2) muscle coordination. These functions are necessary in order to operate a motor vehicle in a safe manner. A human body absorbs alcohol through the stomach and small intestine walls, and then it proceeds to enter the bloodstream. Alcohol remains in the bloodstream, until the liver gradually metabolizes it.
U.S. Impaired Driving Statistics
Based on the data from the Centers for Disease Control and Prevention (“CDC”) and the National Highway Traffic Safety Administration (“NHTSA”), impaired driving statistics show horrifying numbers:
- Each day, in the United States, car crashes that involve drunk drivers – cause 29 deaths. This number absolutely staggering, because it means that drunk driving kills 1 person every 50 minutes.
- From 2006 to 2016, drunk driving accidents caused more 10,000 deaths per year.
- In 2016, 28% of all U.S. auto accident fatalities – 10,497 deaths – were due to alcohol impairment.
- Drunk drivers kill children. In 2016, there were 1,233 traffic fatalities involving children up to 14 years of age; and 17% of those deaths (214) were caused by a drunk driver.
- Other drugs besides alcohol cause approximately 16 percent of car accidents.
- Due to the increased use of marijuana, during weekends and at night time, approximately 13% of drivers are under the influence of marijuana. These drivers have a higher likelihood of getting into a car crash than other drivers.
Measurement of Blood Alcohol Concentration
The standard method for measuring a person’s level of alcohol intoxication is entitled Blood Alcohol Concentration (“BAC”). BAC is the ratio of weight of alcohol per a specific volume of blood. The most common BAC measurement is “g/dL” – i.e. grams per deciliter (one tenth of a liter).
For example, at the BAC level of 0.08 g/dL, the risk of a crash is extremely high. Approximately 33% of all fatal car accidents in the United States involve drunk drivers with BAC of 0.08 g/dL or higher. For that reason, all 50 States, the District of Columbia and Puerto Rico made it illegal to operate a motor vehicle with a BAC that is equal to or higher 0.08 g/dL. It does not mean, however, that it is safe to drive with a BAC of less than 0.08 g/dL. A person’s driving ability can be impaired with the smallest drink. In fact, based on the data from the National Highway Traffic Safety Administration (“NHTSA”), in 2016, 2,017 car crash deaths involved drivers with blood alcohol levels of less than 0.08 g/dL – i.e. ranging from 0.01 g/dL to 0.07 g/dL.
Based on the data from both the CDC and the NHTSA, specific levels of impairment are associated with certain levels of blood alcohol concentration.
Blood Alcohol Concentration (BAC) and Effects on Central Nervous System
- 0.02%: mood alteration, mild loss of judgment, minor body warmth, and the feeling of relaxation
- 0.05%: judgment impairment, lowering of inhibitions, a pleasant feeling, diminished alertness, exaggeration of behavior, and potential difficulties with small-muscle control (for example, inability to focus eyes)
- 0.08%: impairment of judgment, reasoning, memory, and self-control; difficulties with appreciating dangerous situations; and impaired muscle coordination (for example, poor speech, vision, hearing, balance, as well as reaction time)
- 0.10%: slowing of thought process, slurred speech, significantly impaired muscle coordination, and notable decline in control and reaction time
- 0.15%: significant loss of balance, severely impaired muscle control, and potential vomiting (depending on a person’s alcohol tolerance and the speed of alcohol ingestion)
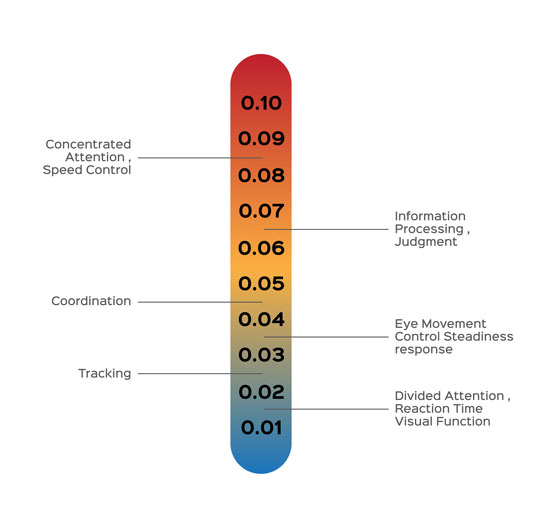
Blood Alcohol Concentration (BAC) and Effects on Driving Ability
- 0.02%: diminished ability to “divide attention” / multitask – i.e. perform two or more tasks at the same time; reduced visual function such as tracking a moving object
- 0.05%: impaired ability to steer a vehicle, further reduction in visual function such as tracking a moving object, diminished coordination and ability to respond to emergency / unexpected driving situations
- 0.08%: significantly impaired concentration, perception, short-term memory, control of speed, and the ability to process visual and audible information (objects and other vehicles on the road, turn signals, sirens, horns, etc.)
- 0.10%: in addition to all of the above impairments, a diminished ability to apply brakes when necessary and maintain an appropriate lane position
- 0.15%: severely impaired ability to concentrate on the process of driving and controlling the vehicle, as well as a major reduction in the ability to process visual and audible signals
Drunk Driving Risk Factors
An analysis by the CDC and the NHTSA shows that the risk factors for drunk driving are: (1) young age; (2) motorcyclists; and (3) drivers with prior convictions for DUI / DWI (driving while impaired / driving under the influence)
Young Age
Regardless of the level of BAC (blood alcohol concentration), young drivers have a higher risk of getting into a car crash than older drivers. In fact, car accidents are the leading cause of death for teenage drivers. In 2016, 39% of all drivers who were involved in drunk driving -related fatal car crashes – were 16 to 24 years of age. During the same year, 2016, among fatal accidents caused by drivers with blood alcohol concentration of 0.08 g/dL or higher, the age groups were as follows:
- 26% of drivers: 21 to 24 years of age;
27% of drivers: 25 to 34 years old; and
22% of drivers: 25 to 44 years.
Motorcyclists
- In 2016, 4,950 motorcycle riders were killed in fatal crashes. 1,259 of them (a quarter) had a blood alcohol concentration (BAC) level of 0.08 g/dL or higher.
Drivers with Prior Convictions for DUI / DWI
Among fatal crashes, drivers with blood alcohol concentration level of 0.08 g/dL or higher are more than 4 times more likely to have a prior record of a DUI / DWI conviction than those drivers who had no alcohol in their blood at the time of the fatal crash.
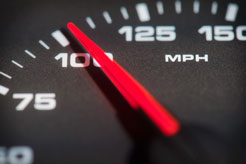
3. Speeding
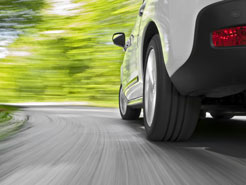
Speeding puts everyone on the road in danger. In the modern world, people have busy schedules, but it is not an excuse for speeding.
Speed limits have been established for a reason – to protect drivers and those around them. However, speeding is a serious problem in the United States. For over 20 years, close to 33% of all fatal traffic crashes were caused by speeding. In 2016, speeding caused 10,111 deaths – that is approximately 27% of all fatal traffic accidents that occurred that year.
Bad driving conditions – such as weather, insufficient lighting, and road repairs – can make it unsafe to travel even at the speed limit. However, when someone exceeds the speed limit under these conditions, this reckless behavior is a recipe for disaster.
- Overloaded schedules: Some people have too many work and personal commitments. As a result, at the time when they are being late for some engagement – business meeting, school, college, or some other appointment – these drivers start speeding.
- Traffic congestion: Today, there are many more cars on the roads than 20-30 years ago, and people drive longer distances. Nevertheless, reasonable drivers must be able to control their frustration. Some drivers, however, instead of dealing with traffic in a responsible manner, adopt aggressive techniques, which include speeding, frequent lane changes, and even road rage and anger with anyone who may potentially be “in their way”.
- Feeling of detachment: By being protected from the outside world in their car, drivers subconsciously act as observers rather than participants. This leads to the relaxation of behavioral constraints and, as a result, causes drivers to speed.
- Recklessness: Some drivers simply have no regard for the laws, traffic rules, and the health and safety of other traffic participants. Whether they do it due to poor impulse control or for pure pleasure, these drivers engage in speeding, racing, aggressive lane changes, and road rage with full knowledge that they are endangering those around them.
If you or a loved one have been injured as a result of the careless speeding by another driver, you will need the assistance of the car accident lawyer Los Angeles residents can rely on.
4. Red Light Violations
In general, in the United States, intersections continue to present some of the highest levels of risk and danger for drivers.
Over 50% of all fatal and injury crashes occur at or near intersections. Based on a study and data by the NHTSA, in 1999 and 2000, fatal accidents at traffic signals involved 9,951 vehicles. Among other causes of intersection crashes, red light running represents a serious problem. Every year, drivers who run red lights cause over 150,000 accidents, and 700-800 of them are fatal crashes. Younger drivers (30 years old and younger) are considerably more likely to run the red light than drivers in other age categories.
5. Wrong-Way Driving

Even though wrong-way crashes are relatively rare, when they do happen, these accidents are almost always catastrophic and the majority of them are fatal.
Even “near miss” situations are extremely psychologically traumatic. Wrong-way crashes are always unexpected. High speeds, at which these accidents typically occur, and alcohol or drug intoxication that is frequently involved, make wrong way crashes especially deadly. Due to the physics of the situation – i.e. the combined speeds of the vehicles in a head-on collision situation, a driver has only seconds to react. Unfortunately, a few seconds is almost always not enough to avert a deadly crash. For example, if both vehicles are traveling at 65 miles per hour, the time to contact and the force of impact will be the same as if the vehicles were traveling towards a stationary object at the speed of 130 miles per hour.
Wrong-way driving situations arise when a driver travels in the wrong direction. The three most common scenarios are:
(1) a driver entered a freeway or a highway through the exit ramp, (2) the driver crossed over a median and entered the oncoming traffic lanes, and (3) the driver entered the oncoming lane of an undivided two-lane road. Frequently, an offending driver passes multiple warning signs, such as “Do Not Enter” and “Wrong Way”; however, the driver does not notice these signs due to alcohol or drug intoxication, inattention or distraction, confusion, or exhaustion. Often, drivers who entered a free-way through the exit ramp merge to the right thinking they are driving in the “slow” lane while, in fact, they are in the fast lane of the oncoming traffic. As the statistics below show, this explains why the majority of head-on crashes occur in high speeds.
Based on the study by the National Transportation Safety Board (“NTSB”), approximately 82% of wrong-way crashes involve “front-to-front” or “head on” collisions at highway speeds where both vehicles travel in the same lane towards each other. Another type of wrong-way accidents involves median crossover accidents. The NTSB analysis of data for 2004 through 2009, shows that, during that period, out of 9,393 accidents on divided high-speed highways, approximately 261 (2.77%) – were fatal wrong-way crashes. Based on the studies by the Federal Highway Administration (“FHWA”) and Highway Safety Information Systems (“HSIS”), most head-on crashes occur on two-lane roads without median dividers.
It appears that, in California, the rate of wrong-way accidents is rising. For example, in 2011, California wrong-way crashes involved 27 fatalities. However, in 2012, the number of deaths almost doubled at 53. In 2014, the wrong-way fatality rate decreased somewhat, but still involved 44 people who were killed.
Los Angeles auto accident lawyer at Cherepinskiy Law Firm is uniquely equipped to handle matters involving “wrong-way” accidents.
Causes of Wrong-Way Driving Crashes
The NHTSA data and research by experts in traffic safety shows that the following are the most common causes of wrong-way accidents:
- Drunk driving: Over 50% of wrong way crashes involve drunk drivers. Typically, the offending driver’s blood alcohol concentration (BAC) level significantly exceeds the legal limit of 0.08 g/dL.
- Drug intoxication: Approximately 4% of wrong way accidents are caused by drivers who are under the influence of drugs.
- Older Age: Among drivers who get involved in wrong-way crashes, senior drivers represent a disproportionately high number. An explanation for this phenomenon is that elderly drivers may get confused or disoriented with respect to traffic and warning signs. As a result, they inadvertently start driving in the wrong direction.
- Night Driving: Over 70% of wrong way accidents occur during nighttime. Most of these crashes happen between 10:00 p.m. and 6:00 a.m., with the 2:00 a.m. – 6:00 a.m. time period showing a spike. Night is the primary time when drunk drivers leave bars and parties, and get on the road. This is also the time period associated with poor lighting and visibility, tiredness, confusion, and exhaustion where even sober drivers might either miss the warning signs or fall asleep behind the wheel.
6. Falling Asleep While Driving
Based on the data from the U.S. Centers for Disease Control and Prevention (“CDC”), approximately over 40 million of adults (approximately 30% of the population) are sleeping 6 or fewer hours every day.
The most sleep-deprived people are in the health care, transportation, and warehouse industries. This problem significantly affects traffic safety, because a high number of sleep-related accidents happen when exhausted and sleep-deprived people are getting off work. Most commonly, sleep-related accidents involve young people (mostly men), shift workers, and people with children.
According to the CDC, approximately 4.2% of American adults indicated that they had fallen asleep while driving during the preceding month. Statistically, in terms of the number of drivers who fall asleep behind the wheel, California holds the top 3rd place. The numbers in the statistics depend on reports. The actual number of instances when people fall asleep while driving is, most likely, higher because people either do not report it when asked or simply do not realize that they had fallen asleep behind the wheel.
In the United States, almost 75% of adults drive a car to and from work. According to a 2005 “Sleep in America” poll by the National Sleep Foundation (“NSF”), many people drive while they are drowsy and the numbers are staggering:
- Approximately 168 million people (60% of adult drivers) – indicated that, in the preceding year, they had driven a vehicle while feeling drowsy or sleepy.
- Approximately 103 million people (37% of drivers) admitted that they had fallen asleep as they were driving.
- Among those who fell asleep behind the wheel, 13% indicated they had done so once a month or even more frequently.
- Approximately 11 million people (4% of drivers) indicated that they actually have had an accident or a “near accident” situation because they either were too exhausted to drive or fell asleep at the wheel.
7. Rollover Crashes
A rollover crash occurs when a vehicle flips one or multiple times and ends up on its side or the roof. Sometimes, a vehicle may come to rest on its wheels.
Traffic safety researchers believe that, when it comes to fatal crashes, rollovers are especially deadly and represent some of the most dangerous accidents. Rollovers are especially deadly.
The causes of rollover crashes depend on multiple factors. Based on the statistical analysis by the NHTSA: almost 85% of all fatal rollovers involved a single vehicle, and more than 90% of these rollover fatalities occurred when vehicles were performing relatively simple maneuvers. This data highlights the fact that drivers’ irresponsible behavior – distracted driving, speeding, and impaired driving – are major causes of rollover crashes. Other important factors involve the type of the vehicle, location, and the environment. The following are the most common causes of rollover crashes:
Common Causes of Rollover Crashes
The Type of Vehicle
Although, potentially, any vehicle may end up in a rollover crash, vehicles with a higher center of gravity – such as sport utility vehicles (“SUV’s”), full size vans and minivans, and pickup trucks – are particularly vulnerable. SUV’s have become very popular. Due to large size of SUV’s, many people have a false sense of security and believe these vehicles are safer than cars. Based on a survey conducted in the U.S. in 2005, almost 40% of surveyed individuals responded that they felt more protected in an SUV. However, among fatal crashes, SUV’s represented 37% and cars represented 15%.
Seat Belts
Research shows that, in rollover crashes, most fatalities involve passengers who do not wear seat belts at the time of the accident. Due to the risk of being ejected from the vehicle at the time of the crash, unbuckled passengers (and drivers) face an almost doubled risk of death.
Speed
Speeding is considered to be one of the most significant causes of rollover crashes, and it leads to nearly 40% of rollover accidents with fatal outcomes.
Drunk Driving
Approximately 50% of rollover fatalities are due to drunk driving. A single drink may affect a driver’s nervous system enough to lead to a rollover crash.
Location
Almost 75% of fatal rollover crashes involved highways in rural areas and other locations with relatively high-speed limits – 55 miles per hour or above.
8. Rear-End Collisions
A rear-end collision happens when a vehicle crashes into the vehicle that is in front of it.
Based on the data from the National Highway Safety Administration (“NHTSA”), rear-end accidents are very common and represent close to 30% of all car accidents in the United States. Rear-end crashes represent 6% of car crash fatalities. Most commonly, these accidents occur when the front vehicle is either moving at a slow speed or braking.
Common Causes of Rear-end Collisions
Speeding
Many rear-end accidents involve speeding. When a vehicle in front of a speeding car suddenly brakes or stops, the speeding automobile does not have sufficient time to slow down or stop in order to avoid running into the back of the vehicle in front of it.
Distracted driving
Inattentive and distracted driving is a major cause of rear-end crashes. This happens because, when they are distracted, drivers do not pay attention to their surroundings such as:
- brake lights of the vehicles in front
- other drivers’ behavior (e.g. aggressive driving, frequent lane changes)
- road conditions (e.g. metal sheets used to cover holes in the pavement during road repair are very slippery)
- weather (e.g. light rain or slightly wet road pavement can cause a vehicle’s tires to skid and the vehicle to hydroplane – slide uncontrollably due to the loss of tire traction)
- road signs
Tailgating (Driving too closely behind another vehicle)
Research shows that most drivers do not focus on the distance between their vehicle and the vehicle in front of them.
Drivers, however, do pay attention to the rate at which this distance changes – if the distance remains unchanged, drivers get a false sense of security and shift their focus elsewhere. When drivers take their eyes off of the road and cars in front of them, they lose the opportunity to timely react to sudden changes such as the car in front of them slamming on the brakes. Even considering the newest safety technology – such as Automatic Collision Avoidance Systems – it is still prudent to use the old principle that, for every 10 miles per hour of speed, the following distance should be one car length.
Cherepinskiy Law Firm’s principal, Dmitriy Cherepinskiy, is a former defense lawyer with multiple years of experience. This expertise places the firm among the best accident lawyers in Los Angeles, and makes it uniquely positioned to fight on behalf of the victims of all car accidents, including rear-end collisions.
9. Side-Impact Crashes
Side impact crashes represent some of the most fatal accidents, second only to head-on collisions.
Pursuant to the data from Insurance Institute for Highway Safety (“IIHS”), side impact crashes represent over 25% of all passenger vehicle fatalities. A car’s side is usually less structurally rigid and strong than the front or the back. Typically, the only protection in a side-impact collision is an airbag (if a car is modern enough to be equipped with a side airbag). However, side airbags are effective only when passengers are tall enough. Unfortunately, shorter individuals are more vulnerable and face a higher risk of significant injury or death for the following reason: their head may not be properly aligned with the deployed airbag and, as a result, shorter people hit the vehicle’s frame instead of the airbag.
Common Causes of side impact crashes
The most common causes of side impact accidents are as follows:
- Failure to yield to another car when required
- Failure to stop at a four-way intersection, and/or “rolling stops” (rolling through a stop sign)
- Aggressive or reckless driving
- Impaired driving
- Distracted driving
- Wrong-way driving
- Red light running
- Speeding
- Failure of equipment and defective parts
- Environmental factors interfering with visibility (e.g. poor lighting and bad weather)
Safe Driving Practices
Cherepinskiy Law Firm, the Los Angeles auto accident attorney, is ready to help after an accident occurs. However, drivers must take affirmative steps to prevent car crashes from happening and to protect themselves, their loved ones, and those around them on the road from injuries and death. These are some of the steps responsible drivers must take to ensure traffic safety:
- Never drink and drive.
- Do not speed.
- Avoid distractions such as checking your e-mails, texts, and social media while driving.
- Always wear seat belts.
- Make sure children are restrained in age-appropriate car-seats and booster seats.
- Obey all traffic rules and pay attention to the road and signs / markings.
- If you did not get enough sleep and feel drowsy – do not drive until you have had a chance to rest and sleep.
What Damages Can be Recovered in Car Accident Cases?
Victims of car accidents can claim the following two main types of damages: Non-Economic and Economic damages. In some situations, those who have been injured in a car crash may potentially seek Punitive Damages. For cases involving future care, Cherepinskiy Law Firm, as the car accident attorney in Los Angeles, retains top expert physicians, life care planners, and economists to evaluate clients’ needs and present the best case on their behalf. A detailed discussion of the recoverable damages is included on the Personal Injury Damages page of this website.
If a car accident resulted in the death of a loved one, then compensation can be sought in a Wrongful Death action.
Take Action! Promptly Contact a Los Angeles Car Accident Attorney for a Free Consultation
The value of any car accident claim depends, in part, on what you do immediately after the accident and subsequent to that. Your decisions and actions can seriously impact your claim and the amount of your potential recovery. Read this firm’s discussion of Twelve Steps to Take After a Motor Vehicle Accident to learn about post-accident safety, obtaining and preserving evidence, dealing with insurance companies, and other useful tips.
If you believe another driver’s carelessness caused your injuries or a loved one’s death, please call or fill out an electronic contact form today to request a free consultation. Cherepinskiy Law Firm, as the car accident lawyer in Los Angeles, will work in a tireless and compassionate manner in a personal injury or a wrongful death case to make sure you are compensated for your injuries and losses.
This firm fights for clients throughout California, including Los Angeles, Orange County, as well as Ventura, Riverside and San Bernardino Counties.
Sources
1. https://crashstats.nhtsa.dot.gov/#/
2. https://www.nhtsa.gov/risky-driving
3. https://safety.fhwa.dot.gov/
4. https://www.hsisinfo.org/
5. https://www.ntsb.gov/safety/Pages/default.aspx